Finding grain orientation in the weilding heat-affected zone with the hough transform
The problem
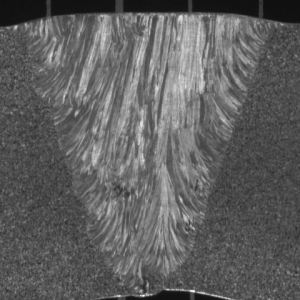
The microstructure of an austenitic weld originates in the dentritic type growth along the axis of the heat flow direction. In some cases, this leads to elongated and oriented grains which can grow with epitaxic process on several millimeters length. An example of metallographic observations on a transversal section of an austenitic weld clearly reveals the columnar grain structure (Figure). It reveals an heterogeneous structure due to the weld geometry: on each side of the weld, the grains are perpendicular to the chamfer and they are slightly tilted with respect to the vertical in the middle of the weld.
Several applications like, for example, Finite Element simulations, requires to determine the local orientation inside the weld.
Image from Bertrand Chassignole, CC-by.
The Hough transform
The Hough transform is a wonderful trick. With a voting system, it tells where there are things looking like a straight line. It tells it in a graph with orientation in abscissa and distance from the “origin” in ordinate. All this is much clearer once you have tested an image with the G’mic command x_hough:
gmic image.jpg -x_hough
Image from Jean-Philippe Mathieu, CC-by.
The Hough transform the way I like it
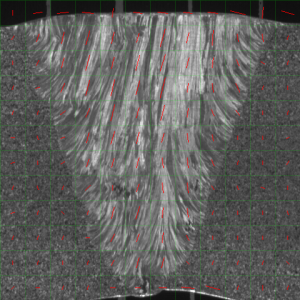
The idea here is to cut the HAZ image in small square samples and to estimate the main orientation of each sample thanks to a hough transform. Since the distance from the origin is of no interest, the hough transform is asked to be one pixel high. The abscissa of the maximum value gives the main orientation.
If the principle is applied to the ladybug picture seen above:
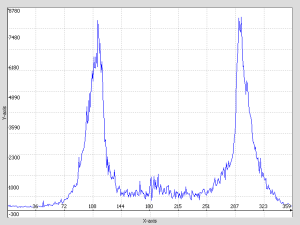
gmic ladybug.jpg -hough 360,1 -display_graph
Two peaks can be seen, one at about 115° and one at about 295° (180° more, which means the same orientation). They both correspond to the herb orientation.
The Custom command
With the 1D hough transform, some treatment is applied to get only one peak. The maximum position gives the main orientation and it is even possible to build a confidence criteria based on the maximum value.
The custom command proposed here takes 2 parameters, one for the sample size and one for the accuracy. Setting a low accuracy is a way to cope with the high frequency oscillation seen on the curve, there are probably better ways to handle that.
At the end the G’mic command below shows a quite acceptable result in less than one second :
gmic macro.gmic haz.png --haz_orientation 40,10 -compose_rgba[0,1] -keep[0]
Edit : from the version 1.5.4.0 on, image blending has been rethought, thus the command line above becomes:
gmic macro.gmic haz.png --haz_orientation 40,10 -blend[0,1] alpha -keep[0]
The future
Of course, it can be much improved. As already said, the custom command can be refined to be more accurate by applying for example some gaussian blur on the 1D hough transform. “Some people” will want to get an orientation estimation at each pixel, this should be easy to make. And it would be great to get that estimation only based on information inside the HAZ, this will require some thinking and probably some semi-manual HAZ contouring. It will also quickly become important to be able to handle pictures with small defects inside because HAZ photography can not always be that clean. For that, I plan to make some inpainting in zones whose values are too different from their neighborhood, but I face an awkward issue : how to make G’mic understand that 0° and 179° are not distant numbers?


I like this idea as I’m interested in texture patches for de-noising and these have local regularity. Re. your “?” .. in the 1-d parameter of angle the distance 0 vs 179 is indeed large .. but you have a natural transform to the unit circle embedded in 2d space x -> ( Cos 2x , Sin 2x ) where Euclidian distance in the 2-d space has the right topology doesn’t it?
Thank you for your comment. I think you are right, using ( Cos 2x , Sin 2x ) should be a reasonable solution. Since I wrote that post, this idea has matured and I’ll have to try it in 2013.
> 100 blocks analysed for simple peak value location in each hough-space (360×1)
> 10×10 false colour output in red-green space is from those angles (cos 2x)
command line
./gmic haz.png -split_tiles 10,10 -hough 360,1 -b 5,1 1,1,1,100,0 -repeat @# -set[-1] "@{$<,C},$<" -done -rm[0-99] -s c,10 -a y -s c,10 -a x -* "{pi/90}" 10,10,1,1,1 -mv[1] 0 -polar2complex -a c
commentary of above
haz.png # source image
-split_tiles 10,10 # process the image as an array of patches
-hough 360,1 # hough transform could be improved with edge enhancement maybe
-b 5,1 # blur across the neighbouring angles to denoise the peak position
1,1,1,100,0 # create a 100 colour space as C returns trailing 0s
-repeat @# # loop over the number of images
-set[-1] "@{$<,C},$<" # colour the pixel according to x coordinate
-done # see repeat
-rm[0-99] # remove the hough transformed blocks keep only the image of max values
-s c,10 -a y # split colour and rejoin as 10 rows
-s c,10 -a x # split colour again and rejoin as 10 columns
-* "{pi/90}" # scale angles
10,10,1,1,1 -mv[1] 0 # add a unit norm
-polar2complex -a c# convert to reg-green colour
Hi,
I finally found some time to look at your script. Thank you, this is interesting, clean and commented. I might use it.
have been looking at the Hough/Radon transform and its inverse (x-ray tomography) .. but for orientation I made a better picture from just using gradient vectors, doubling the angle before blurring, as this is faster and more flexible than block-wise hough transforms .. script and example result is here : http://www.flickr.com/photos/jayprich/8342696278